Equilibrium Control questions 140820
Statics: The Definition Of Equilibrium.
Comparative Statics
Dynamics
Everyone who had some teaching in economics tends to consider what is called the
"law" or "theory" or simply "schedules" of supply and demand
to be basic for the understanding of economics. It is the first thing you learn and little
economics can be understood without it. Most people nowadays asked to explain this
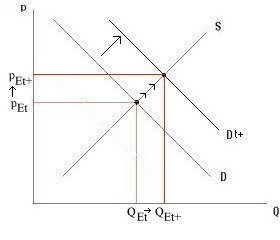
cornerstone tend to come up with a cross like in this graph: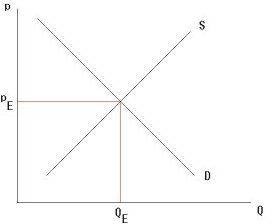 The S-schedule represents the idea that, the
higher the price p, the higher the quantity Q the producers will supply.
The S-schedule represents the idea that, the
higher the price p, the higher the quantity Q the producers will supply.
The D-schedule represents the idea that, the higher the price, the lower the quantity the
consumers will demand. (QE,pE) represent the equilibrium, defined as
the price at which the quantities demanded and supplied are equal. For the usual equations
of this model, click here
Quantity, price of what? Of "some" commodity. Economists often start
with a commodity like apples: the price of apples can not be higher than pE for
long, because at such higher price the quantity supplied is larger that the quantity
demanded, suppliers will lower their supply price in order to sell their stocks. Neither
can it be lower than pE, because that would lead to a "line" of eager
consumers too large for the stock on sale. When it will be the turn of those in the rear
of the line, the sellers will be out of stock. Consumers will compete ("crowd")
by bidding up. There is only one unique single equilibrium price (pE)
and quantity (QE) without such unrest of "crowding" buyers or
sellers. This will be attained as a result of the "market forces".
But you have different types of apples. Should we draw a different cross for every type
of apple? And, even stronger: if, in a supermarket, I pay the same price for every
one apple of the same type and I need five, I will carefully select the best. My selection
in the supermarket would be different if every single apple carried a slightly different
price tag. Should I draw a separate cross for every single apple? It is
even harder to tell how to apply the cross to shoes. Nobody expects a unique
single equilibrium price for all shoes, not even under "perfect"
conditions. Now what does the cross mean for the market of shoes?
The supply and demand model does not describe the apple market. Nor does it describe
the shoe market. It describes a market were the commodities are completely
indistinguishable. There are no such markets on earth. That is why the model is
called an idealisation. The economist makes a theory about a
thing that does not exist, hoping it looks enough like existing things to learn something
about them.
This is not something peculiar for economics. Ideal models
are used in all sciences.
The cross implies that there is one and only one equilibrium point (pE,QE).
That means that in the idealisation is a static world where nothing changes. Statics
is something done in a lot of different sciences.
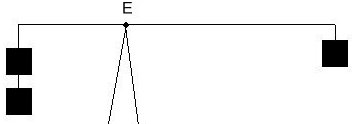 An example in
elementary physics is the analysis of the balance (see right) that says that if
"weight" multiplied by "arm" as both sides of the balance is equal,
the balance is in equilibrium. In the illustration to the right, there is one and only one
point E on which you can suspend the perfectly stiff vertical bar such that it will not
fall to either of the sides. Note that this is idealisation too: no physicist seriously
believes that it is possible in practise to do this. You will always make a small
mistake and the balance will fall. Like economists, physicists believe in the truth of
something not perfectly testable in practise.
An example in
elementary physics is the analysis of the balance (see right) that says that if
"weight" multiplied by "arm" as both sides of the balance is equal,
the balance is in equilibrium. In the illustration to the right, there is one and only one
point E on which you can suspend the perfectly stiff vertical bar such that it will not
fall to either of the sides. Note that this is idealisation too: no physicist seriously
believes that it is possible in practise to do this. You will always make a small
mistake and the balance will fall. Like economists, physicists believe in the truth of
something not perfectly testable in practise.
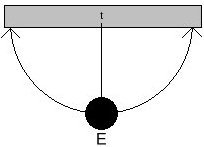 Another example of
physics is the pendulum, like a metal ball hanging from a ceiling (left): The static
analysis of the pendulum says that there is only one equilibrium position E in which there
are no forces that will put the pendulum into movement: where it hangs vertical, that is
right between its point of suspension t and the centre of its gravity field. But no
physicist believes there has ever been such a perfect situation for any pendulum.
Another example of
physics is the pendulum, like a metal ball hanging from a ceiling (left): The static
analysis of the pendulum says that there is only one equilibrium position E in which there
are no forces that will put the pendulum into movement: where it hangs vertical, that is
right between its point of suspension t and the centre of its gravity field. But no
physicist believes there has ever been such a perfect situation for any pendulum.
Comparative Statics: Equilibrium
Displacements
Statics Dynamics
 Though you can learn
from building, in your mind, imaginary static worlds where nothing changes, you can learn
more by assuming change. This means you have to introduce some new force causing change.
Though you can learn
from building, in your mind, imaginary static worlds where nothing changes, you can learn
more by assuming change. This means you have to introduce some new force causing change.
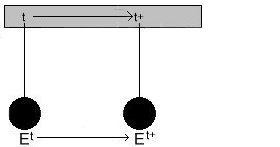
In the pendulum example, this could be your own hand, hanging the pendulum at another
place: your hand changes t into t+, and thereby displaces the equilibrium from t to t+.
This analysis is called comparative statics: you compare two static equilibria Et
and Et+. And your theorem is: if t moves to t+, Et moves to Et+,
which is in the same direction. You prove it from the static model, the only thing you add
is the imaginary hand that moves the point of suspension.
 To do the same with the cross,
to turn it into a comparative static analysis of changes, we have to introduce
something like the hand in the pendulum case. That is called an exogenous variable:
a variable causing change, but not itself affected by the change. Let us call this
variable t, let us fix on an example: a market for ice. Let t be weather temperature, a
force affecting demand for ice, but not itself influenced by the ice market in any way. A
truly exogenous variable. The "hand" of temperature displaces the equilibrium on
the ice market, and we can study how by studying where the equilibrium of the cross is
going.
To do the same with the cross,
to turn it into a comparative static analysis of changes, we have to introduce
something like the hand in the pendulum case. That is called an exogenous variable:
a variable causing change, but not itself affected by the change. Let us call this
variable t, let us fix on an example: a market for ice. Let t be weather temperature, a
force affecting demand for ice, but not itself influenced by the ice market in any way. A
truly exogenous variable. The "hand" of temperature displaces the equilibrium on
the ice market, and we can study how by studying where the equilibrium of the cross is
going.
We imagine that the temperature shifts the demand schedule to the right: at every price:
demand for ice is larger if temperature is higher. If temperature shifts from t to t+,
this has two effects: equilibrium price goes from pEt to pEt+.
Equilibrium quantity traded goes from QEt to QEt+. Like in moving
the point of suspension of the pendulum, you have a theorem: if S is upward to the right,
and t moves D to the right, a rise of t raises both pE and QE.
Generally: pE and QE move in the same direction as t. That
means: on warmer days, more ice is sold more expensively.
That is a classical example of a comparative static theorem.
Dynamics: the Path to Equilibrium
Statics Comparative Statics
The comparative static analysis of the cross is the first step to formulate the
mechanism by which market equilibrium comes about. That is the analysis of the time
path followed by the variables when there is no equilibrium, as they move from one
equilibrium to another. In the pendulum example we would have to consider how fast we move
the point of suspension with our hand:
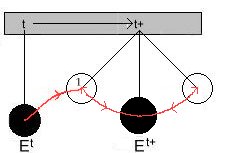 There will be the
first pull caused by the hand. In doing this, the ball will not be pulled immediately to
the new equilibrium position, but only to the left white circle (1). This is due to
what is called inertia: a force does not move heavy things full speed at once.
After having reached (1) and being suspended at new point t+, a regular pendulum motion
sets in, dampened by resistance until the pendulum hangs in its new equilibrium position Et+.
To do the dynamics of a process, the time process has to be thought over and modelled. How
to do this in the supply and demand case?
There will be the
first pull caused by the hand. In doing this, the ball will not be pulled immediately to
the new equilibrium position, but only to the left white circle (1). This is due to
what is called inertia: a force does not move heavy things full speed at once.
After having reached (1) and being suspended at new point t+, a regular pendulum motion
sets in, dampened by resistance until the pendulum hangs in its new equilibrium position Et+.
To do the dynamics of a process, the time process has to be thought over and modelled. How
to do this in the supply and demand case?
The consumers react on high price by decreasing demand, producers by increasing supply.
That involves reaction time. A standard teaching case is where consumers react
immediately, and producers need some time to adapt supply to the market. This results in
the "cobweb" type of tendency to equilibrium: Suppose equilibrium Et
for temperature t has settled on the ice market. Some day, temperature rises to t+. Now
suppose demand changes on the same day but suppliers experience "inertia",
like in the pendulum case: they need one day in order to adapt to changes in demand.
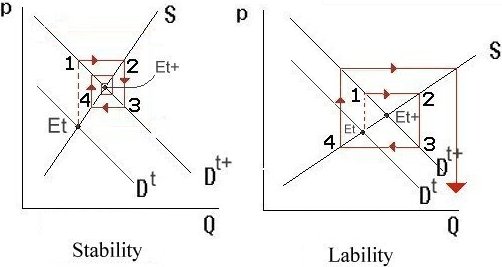
In initial situation 1, suppliers face a demand at which they had wished to supply a
quantity according to point 2. They go home dissatisfied and make new plans for the next
day. The second day, they supply a quantity according to 2, but discover that, at that
quantity, they can only clear their market if they sell sell at a price according to 3.
The third day, they sell a quantity belonging to their supply curve at the price of 3,
that is, according to 4. Whether or not supplier's decisions will thus approach market
equilibrium, depends on the slope of S relative to D. In the right hand side graph, these
slopes are such that the market gets out of hand.
The aims of dynamics are to find out
- will equilibrium settle (is the system stable)?
- what determines the path the system follows and the speed by which it does so?