Bert hamminga The Keynesian
Multiplier Control Questions
The Keynesian multiplier theory is a beautifully simple example of how economists try
to acquire and establish knowledge on the economy by deducing interesting theorems
from plausible assumptions.
In the simplest case, firms receive from households money for only two types of
purposes: either households spend for consumption C, or they spend it to goods meant to
earn money with in the future, in which case households are said to invest, I. Together
these two types of spending sum to total spending, called income Y. Thus Y is just a name
for the addition of C and I. In equilibrium, households receive this same amount Y from
firms as wage, rent, profit and interest. This is again in turn the money they can spend
to consumption or non-consumption. What is not consumed results by definition in
investment (if non-consumption, called "saving" is unexpectedly large, part of
the resulting investment might be "forced investment" in firms left which a
increased stock of unexpectedly unsold goods).
Thus the key question becomes how people decide on their level of consumption. That,
Keynes convinces us easily, must relate to their income (go up and down with it). And this
one single highly plausible assumption is all he needs to deduce the interesting theorem
that if people consume, say, 80% of their income, any increase in investment will
result in five times this increase in income.
The deduction is:
Definition Y = C + I
Assumption DC/DY = c
Hence DC = c * DY
Hence DY = DC + DI = c * DY + DI
Theorem: DY = 1 /(1-c) * DI
One wonders how Keynes' famous book, The General Theory of Employment, Interest and
Money, Cambridge: Macmillan, Cambridge University Press, 1936, got so many (428)
pages!
Now what does Keynes' theorem mean empirically? Keynes analysis is comparative statics. He compares two
equilibrium states, one with an old level of investment I and one with a new level I
+ DI. There are corresponding old equilibrium levels of C
and Y, and new equilibrium levels C + DC and Y + DY. About the relation between these, Keynes deduced the theorem
DY = (1 /(1-c)) * DI
It was not Keynes' strategy to test his theory by collecting data concerning
equilibrium levels in real economies. In fact, he regarded that as impossible: a real
world equilibrium would require a host of secondary factors to remain constant for some
time in order for the economy to come to "rest" in its equilibrium, much like a
pendulum should not be disturbed in order to come to rest in a vertical position. But a
pendulum can be put in laboratory conditions, whereas an economy can not. The result is a
continuous battering of the economic system by shocks that never allow it to come to rest.
Economic equilibrium is unobservable in practise: there are always shocks. That is why,
according to many theoretical economists, and Keynes is among them, unobservable
tendencies should be discovered by deducing them from plausible assumptions.
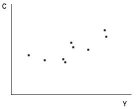
Now what does Keynes' assumption mean empirically? How does it relate to say a
data set for every quarter of a year for some economy, where every observed (C,Y) of every
quarter is a point in figure 1? Does Keynes' assumption mean that there is a constant c
defining a straight line relation between income and the resulting consumption?
 That would
mean that if these points (figure right) are not on a straight line, the hypothesis of the
consumption function would have to be regarded as falsified. In fact, Keynes's theory was
published in the first days of econometrics and Tinbergen had made first attempts to
estimate the lines suggested by economic theories to go through sets of data like in the
figure right. Keynes opposed such methods.
That would
mean that if these points (figure right) are not on a straight line, the hypothesis of the
consumption function would have to be regarded as falsified. In fact, Keynes's theory was
published in the first days of econometrics and Tinbergen had made first attempts to
estimate the lines suggested by economic theories to go through sets of data like in the
figure right. Keynes opposed such methods.
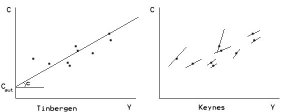 The strongest
empirical requirement would be to demand that all data should be on a straight line, if
not the theory of the consumption function is falsified. Tinbergen, a pioneer in
econometrics, had a weaker requirement: the hypothesis that deviations of the data from
some straight line are caused by factors that, have no effect on average. Tinbergen
claimed in the 1940's that if there is a straight line relation, then it can be estimated
by calculating the line closest to the data. This research by Tinbergen is generally
thought to mark the beginnings of econometrics as we now know it. Keynes opposes fiercely
the econometric method. He objects that the continuous shocks on the system cause the
consumption function to differ (shift) all the time. In order to obtain an estimation, one
should zoom in on one of these different consumption functions, but then there are not
enough data. Economics, Keynes writes, can not be a kind of physics of society, it must
necessarily remain a logic. Such a logic of tendencies is possible because, though c
shifts all the time, it is more stable then C and I (but not stable enough to allow
estimation according to Tinbergen's method).
The strongest
empirical requirement would be to demand that all data should be on a straight line, if
not the theory of the consumption function is falsified. Tinbergen, a pioneer in
econometrics, had a weaker requirement: the hypothesis that deviations of the data from
some straight line are caused by factors that, have no effect on average. Tinbergen
claimed in the 1940's that if there is a straight line relation, then it can be estimated
by calculating the line closest to the data. This research by Tinbergen is generally
thought to mark the beginnings of econometrics as we now know it. Keynes opposes fiercely
the econometric method. He objects that the continuous shocks on the system cause the
consumption function to differ (shift) all the time. In order to obtain an estimation, one
should zoom in on one of these different consumption functions, but then there are not
enough data. Economics, Keynes writes, can not be a kind of physics of society, it must
necessarily remain a logic. Such a logic of tendencies is possible because, though c
shifts all the time, it is more stable then C and I (but not stable enough to allow
estimation according to Tinbergen's method).
This was Keynes' view. Many economists do not share his idea that economics is a
kind of logic. Theoretical economists still practise their trade in the way described by
Keynes, but a large class of economists have emerged since Tinbergens start who do attempt
to estimate relationships, despite Keynes' warnings. The often feel so different that they
form separate sections and departments in their universities.